|
Followings are the code that I wrote in Octave to creates all the plots shown in this page. You may copy these code and play with these codes. Change variables and try yourself until you get your own intuitive understanding.
< Code 1 >
theta = -1.0*pi/2:pi/100:1.0*pi/2;
phaseShift = exp(-j*2*pi/8);
pn = 20;
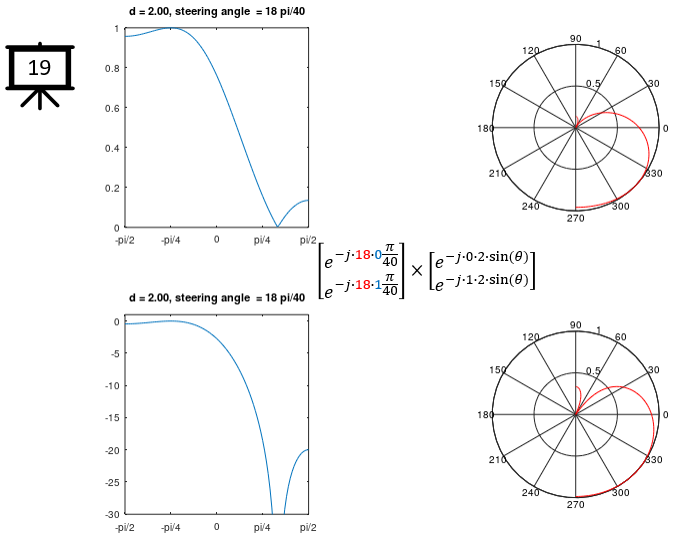
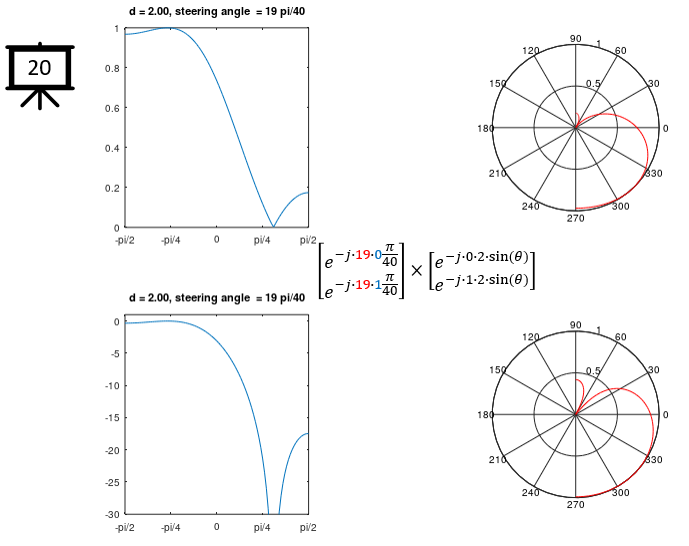
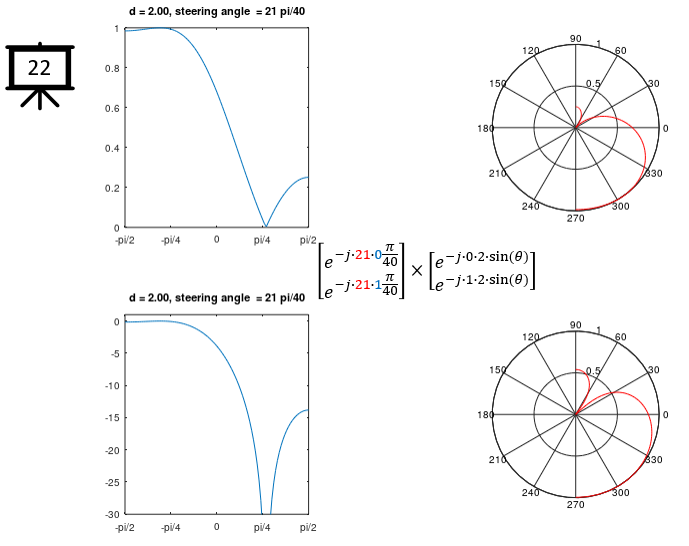
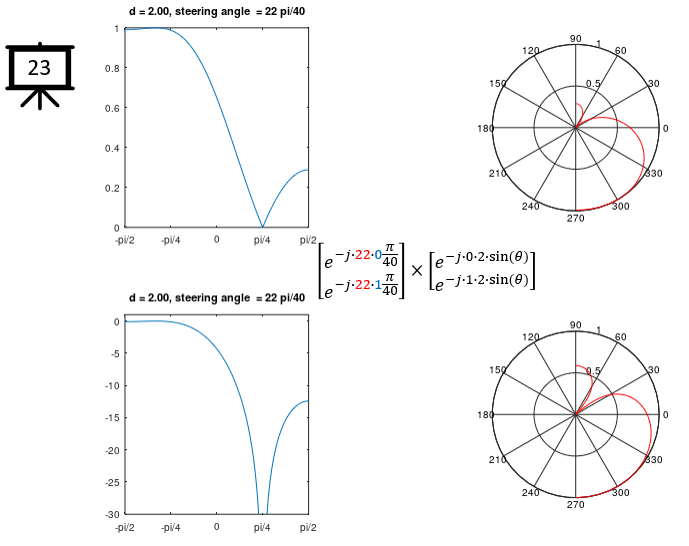
p = pn*pi/20;
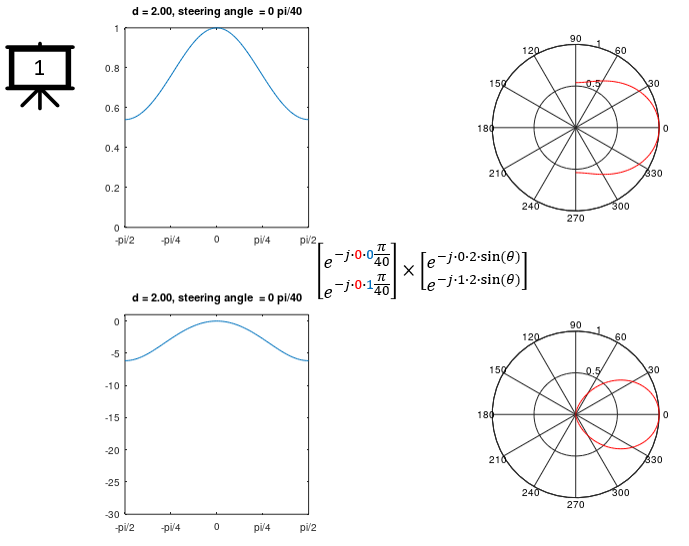
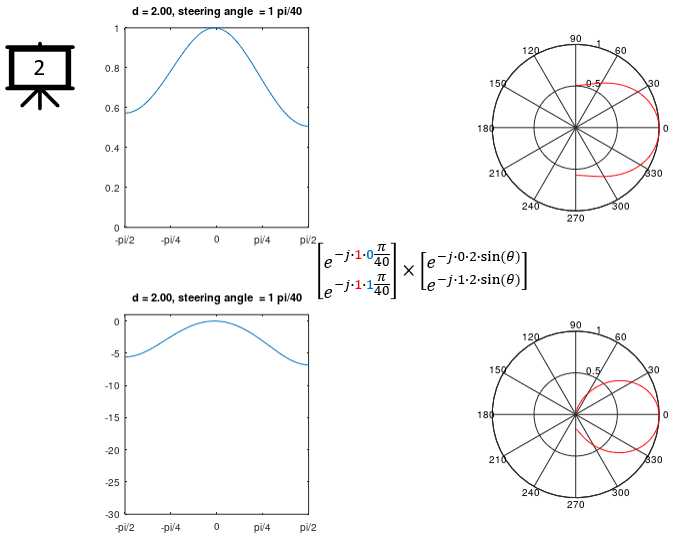
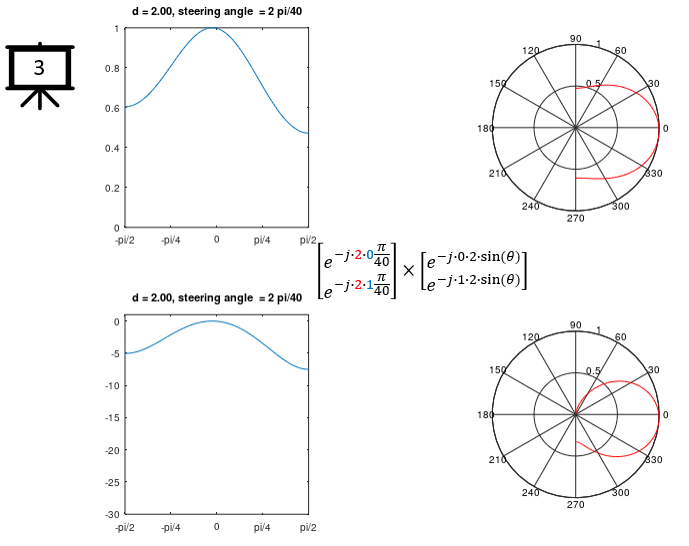
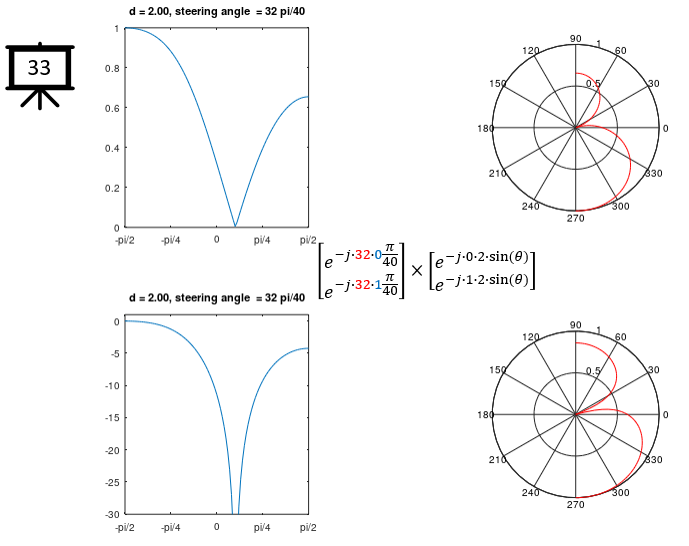
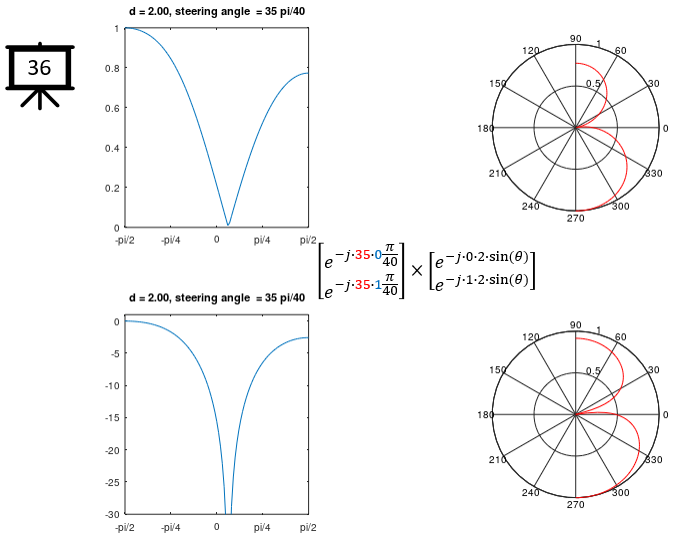
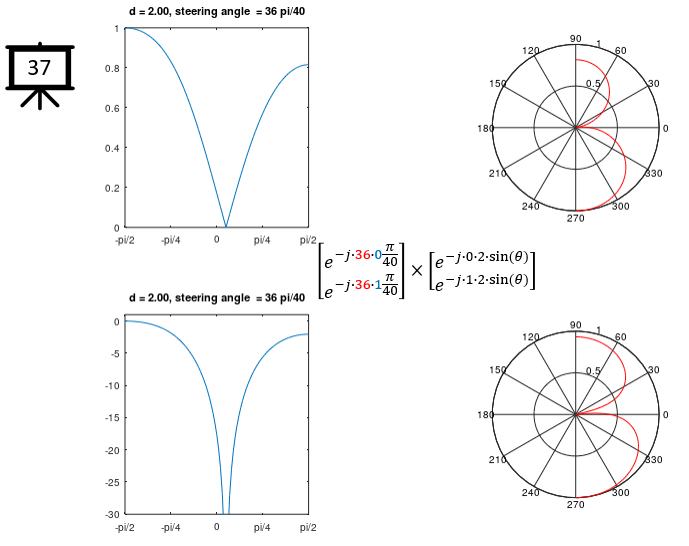
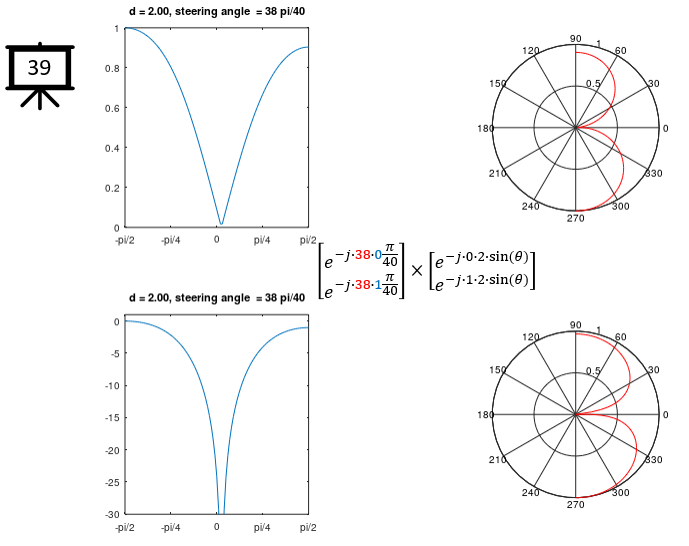
d = 2.0;
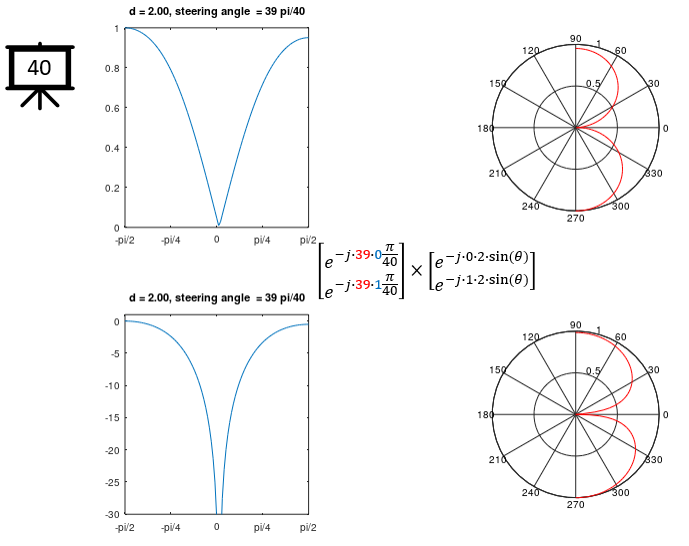
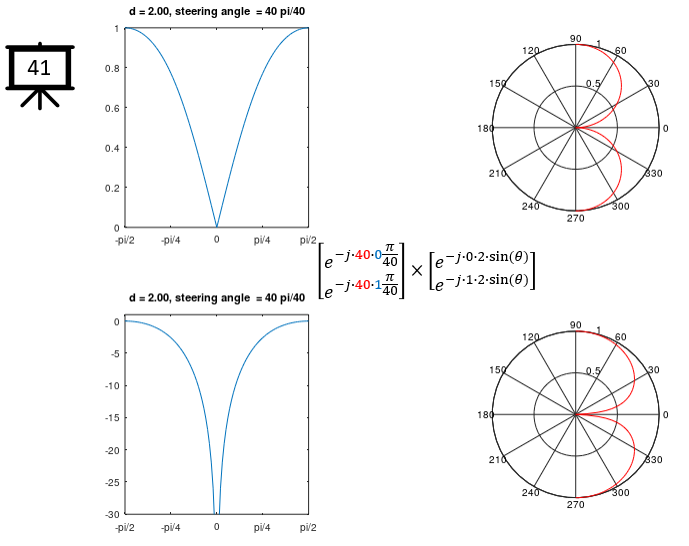
sn = 40;
sta = -sn*pi/40; %Steering Angle
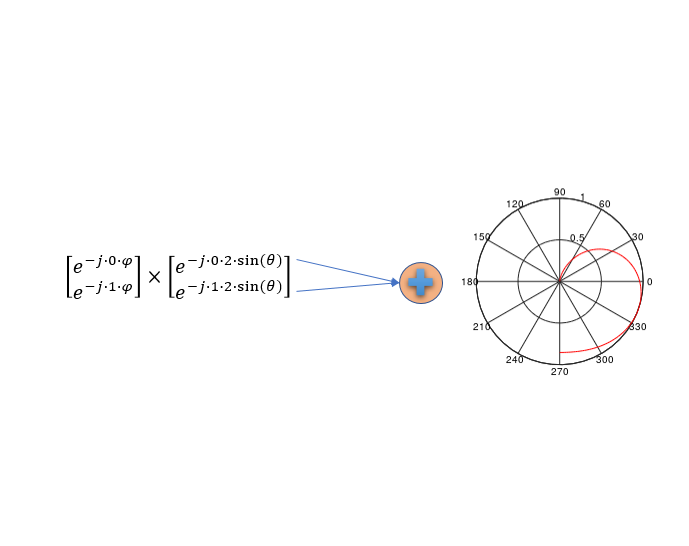
a_theta = [exp(-j .* 0 .* d .* sin(theta)) ;
exp(-j .* 1 .* d .* sin(theta));
exp(-j .* 2 .* d .* sin(theta));
exp(-j .* 3 .* d .* sin(theta));
exp(-j .* 4 .* d .* sin(theta));
exp(-j .* 5 .* d .* sin(theta));
exp(-j .* 6 .* d .* sin(theta));
exp(-j .* 7 .* d .* sin(theta))];
stv = [-exp(j * 0 * sta);
-exp(j * 1 * sta);
-exp(j * 2 * sta);
-exp(j * 3 * sta);
-exp(j * 4 * sta);
-exp(j * 5 * sta);
-exp(j * 6 * sta);
-exp(j * 7 * sta)];
a_theta = stv .* a_theta;
a_theta_sum = sum(a_theta);
%s_theta_sum = sum(s_theta);
a_theta_sum_abs = abs(a_theta_sum);
a_theta_sum_abs = a_theta_sum_abs ./ max(a_theta_sum_abs);
a_theta_sum_abs_dB = 10 .* log(a_theta_sum_abs);
for i = 1:length(a_theta_sum_abs_dB)
if a_theta_sum_abs_dB(i) <= -30
a_theta_sum_abs_dB(i) = -30;
end;
end;
a_theta_sum_abs_dB = a_theta_sum_abs_dB - min(a_theta_sum_abs_dB);
if max(a_theta_sum_abs_dB) != 0
a_theta_sum_abs_dB = a_theta_sum_abs_dB/max(a_theta_sum_abs_dB);
end
hFig = figure(1,'Position',[300 300 700 600]);
subplot(2,5,[1 2]);
plot(theta,a_theta_sum_abs);
xlim([-pi/2 pi/2]);
ylim([0 1]);
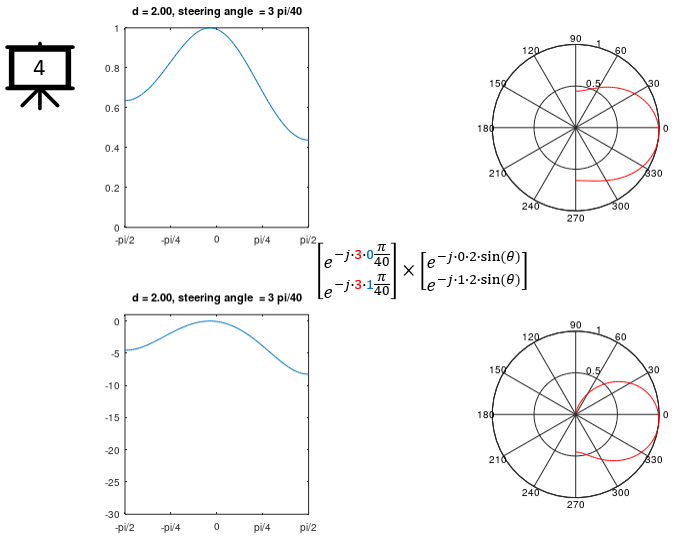
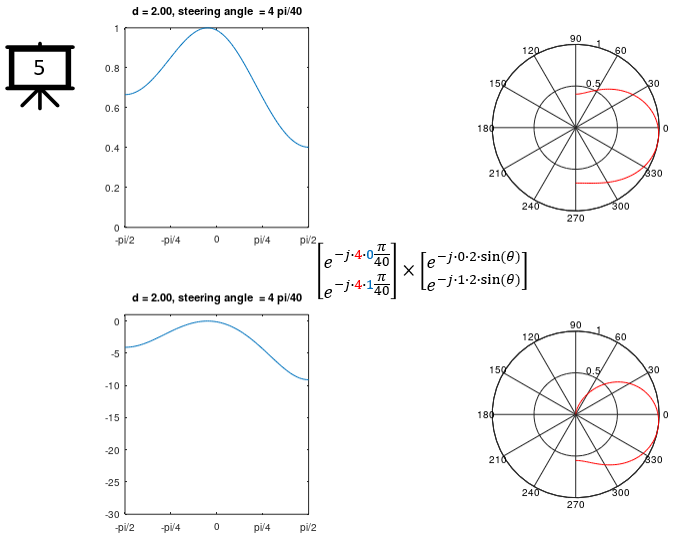
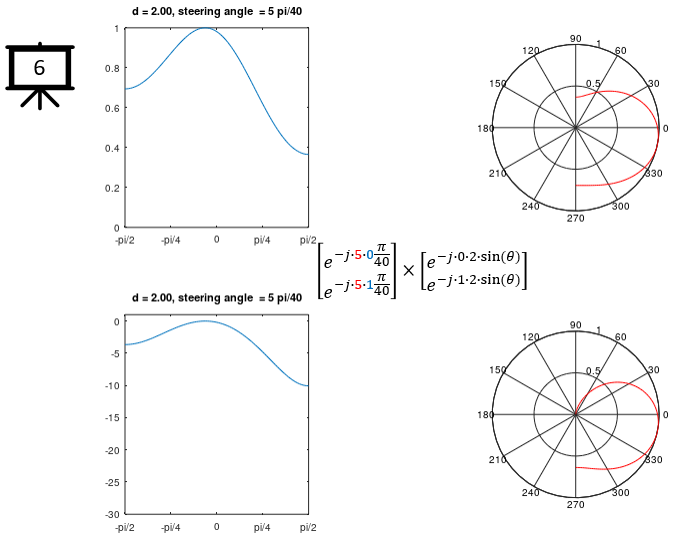
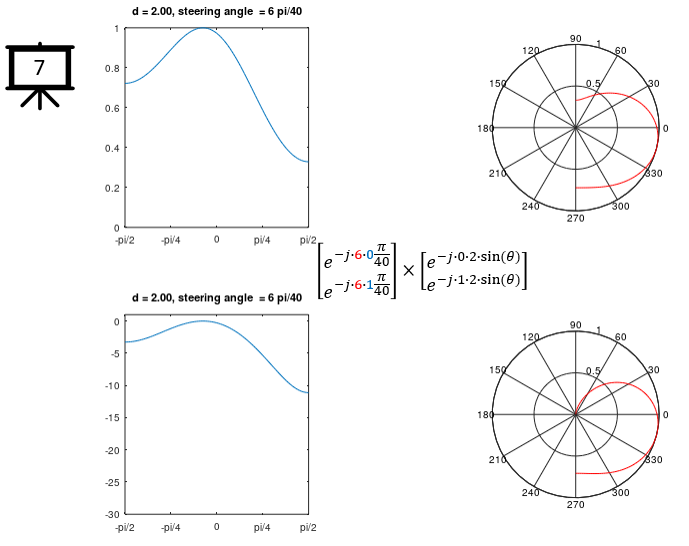
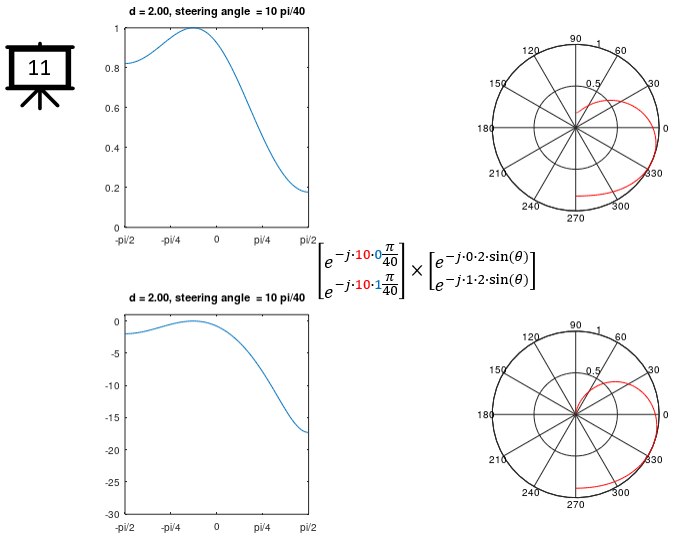
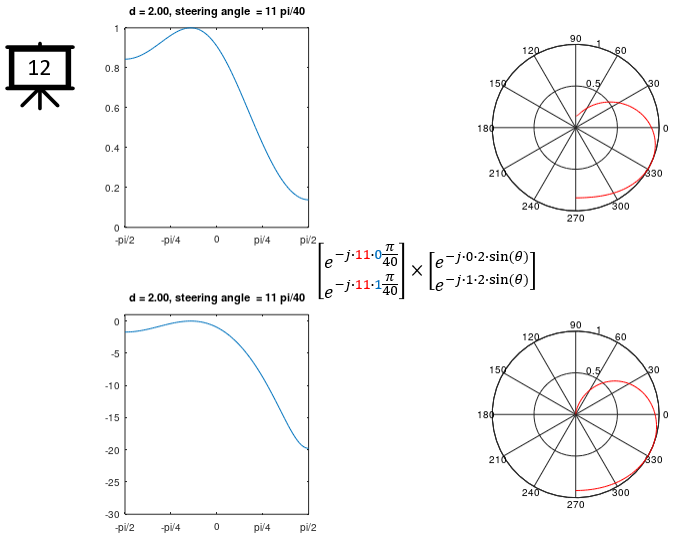
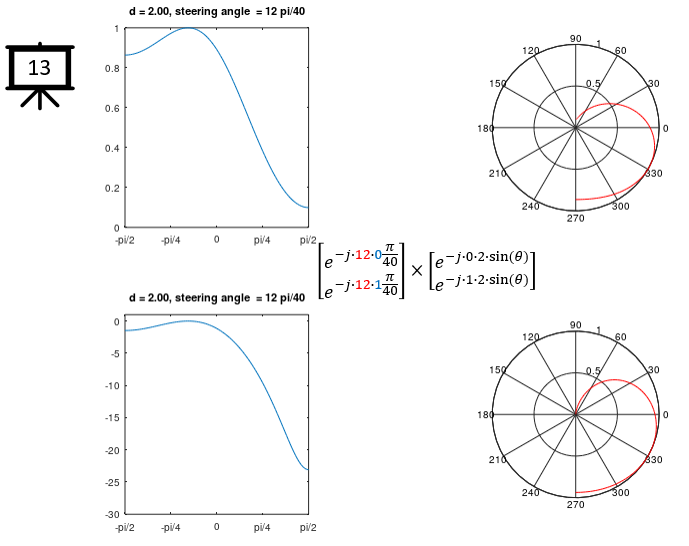
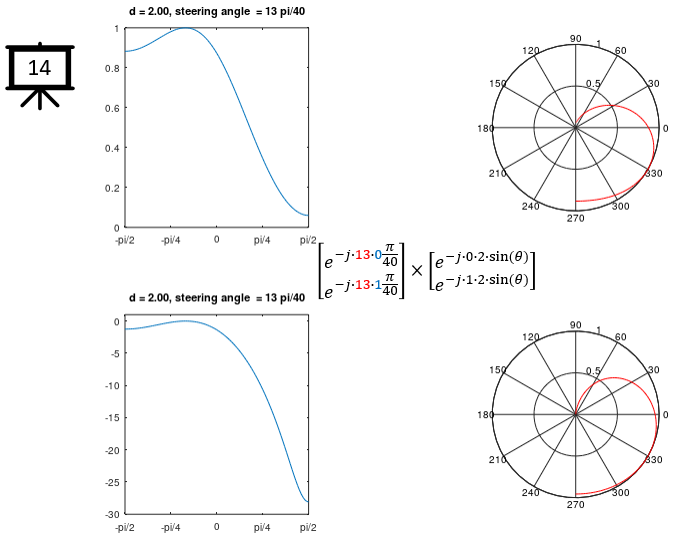
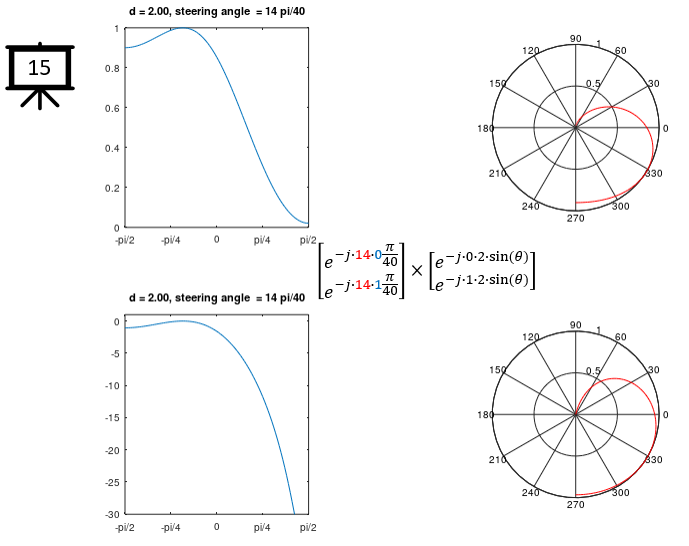
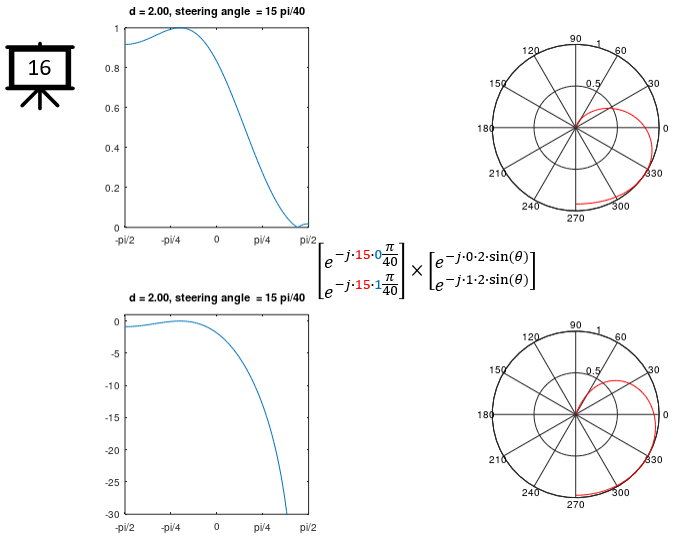
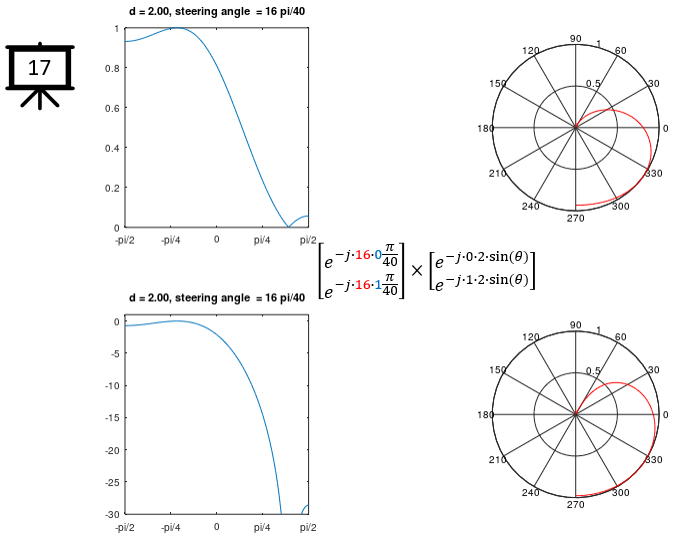
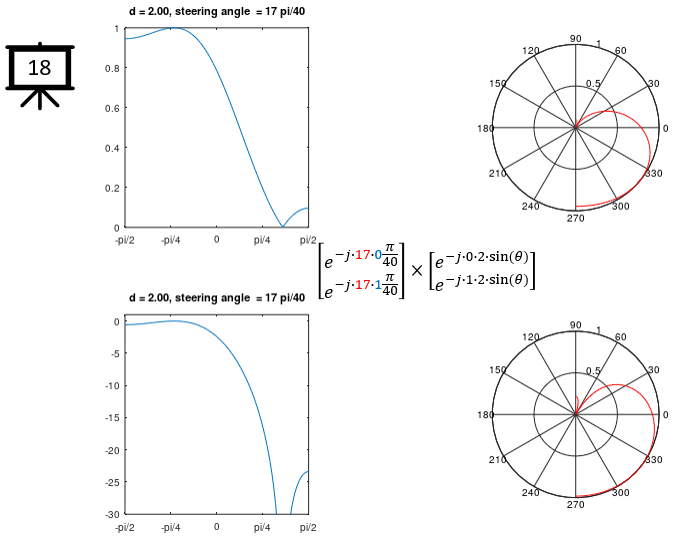
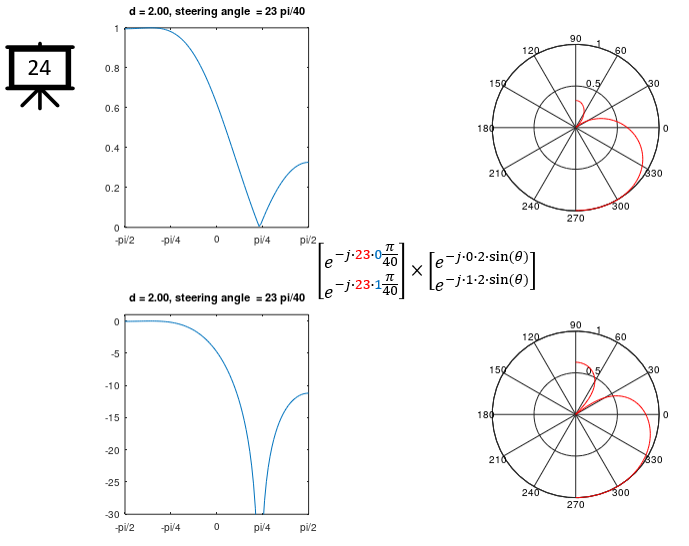
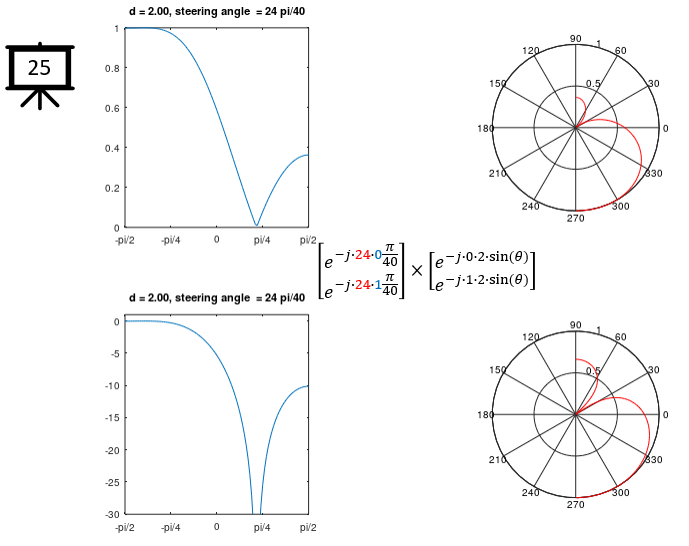
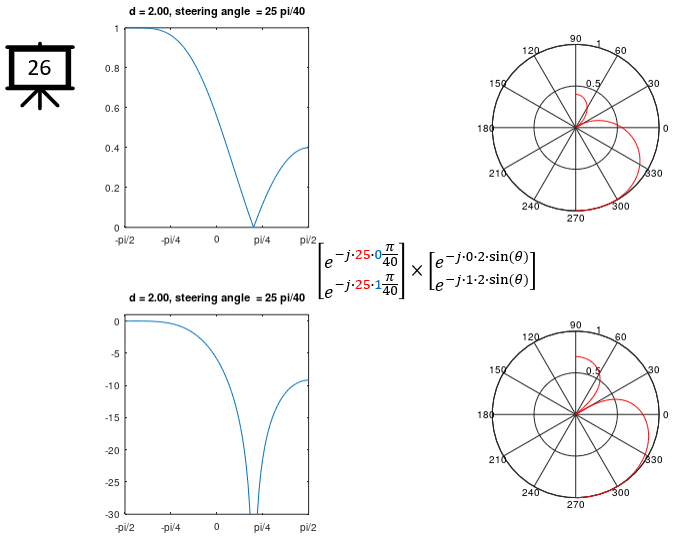
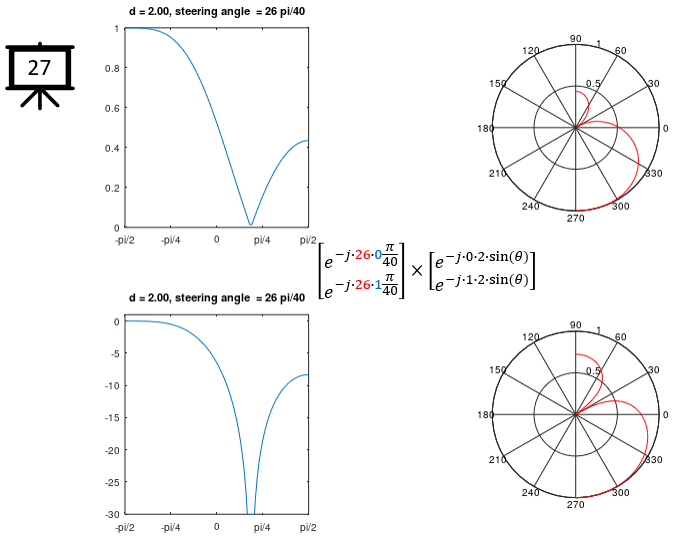
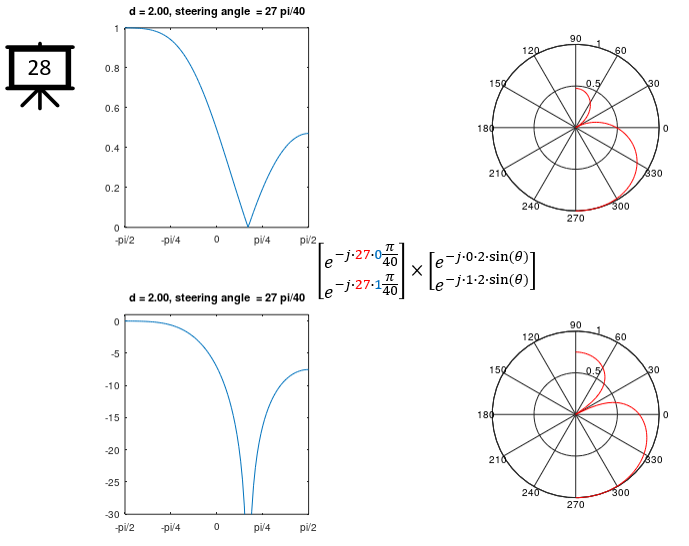
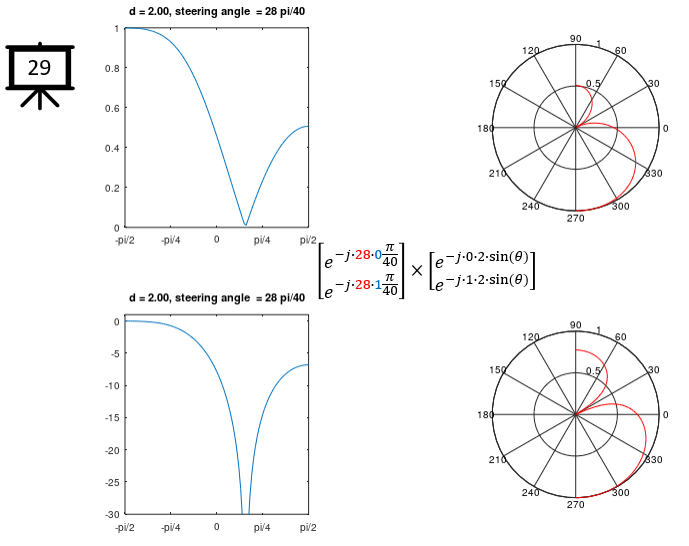
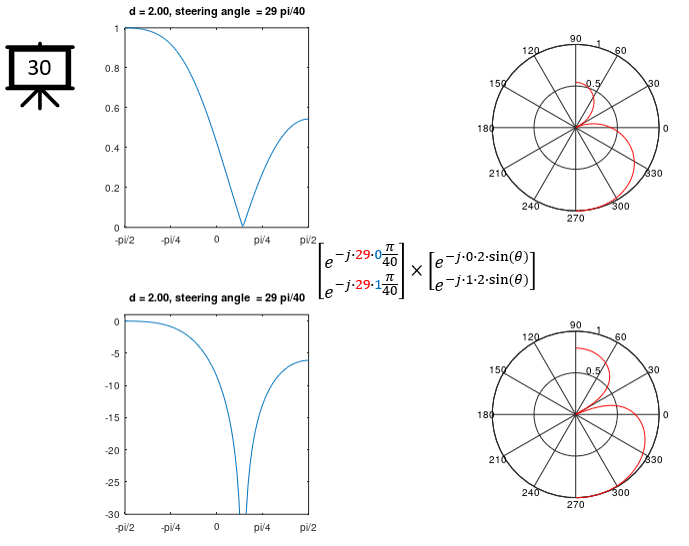
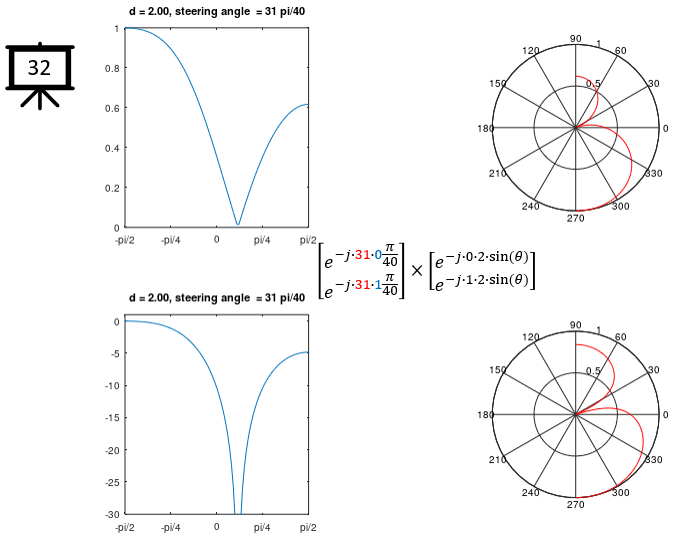
tStr = sprintf("d = %0.2f, steering angle = %d pi/40",d,sn);
title(tStr);
set(gca,'xtick',[-pi -(3/4)*pi -pi/2 -pi/4 0 pi/4 pi/2 (3/4)*pi pi]);
set(gca,'xticklabel',{'-pi','-3pi/4','-pi/2' '-pi/4' '0' 'pi/4' 'pi/2','-3pi/4','pi'});
subplot(2,5,[4 5]);
polar(theta,a_theta_sum_abs,'-r');
t = findall(gcf,'type','text');
%delete(t);
subplot(2,5,[6 7]);plot(theta,10 .* log(a_theta_sum_abs));ylim([-30 1]);
xlim([-pi/2 pi/2]);
tStr = sprintf("d = %0.2f, steering angle = %d pi/40",d,sn);
title(tStr);
set(gca,'xtick',[-pi -(3/4)*pi -pi/2 -pi/4 0 pi/4 pi/2 (3/4)*pi pi]);
set(gca,'xticklabel',{'-pi','-3pi/4','-pi/2' '-pi/4' '0' 'pi/4' 'pi/2','-3pi/4','pi'});
subplot(2,5,[9 10]);
polar(theta,a_theta_sum_abs_dB,'-r');
t = findall(gcf,'type','text');
|