|
t = linspace(0,2*pi,80);
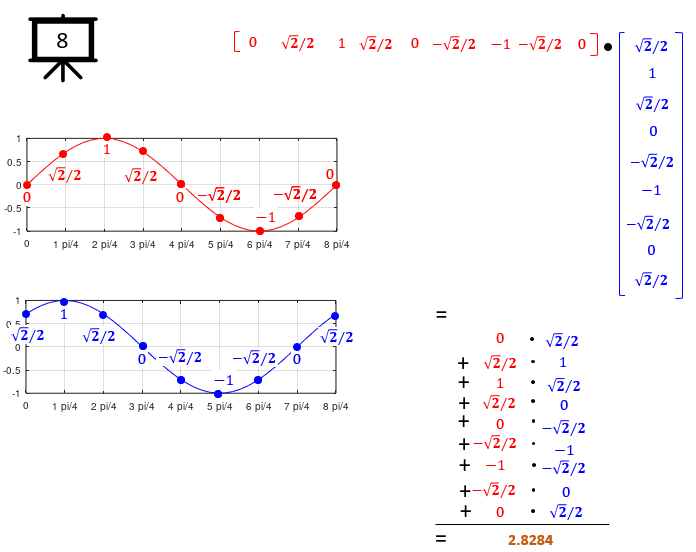
nt = [0 1/4*pi 2/4*pi 3/4*pi 4/4*pi 5/4*pi 6/4*pi 7/4*pi 8/4*pi];
hFig = figure(1,'Position',[300 300 400 300]);
subplot(2,3,[1 2 3]);
hold on;
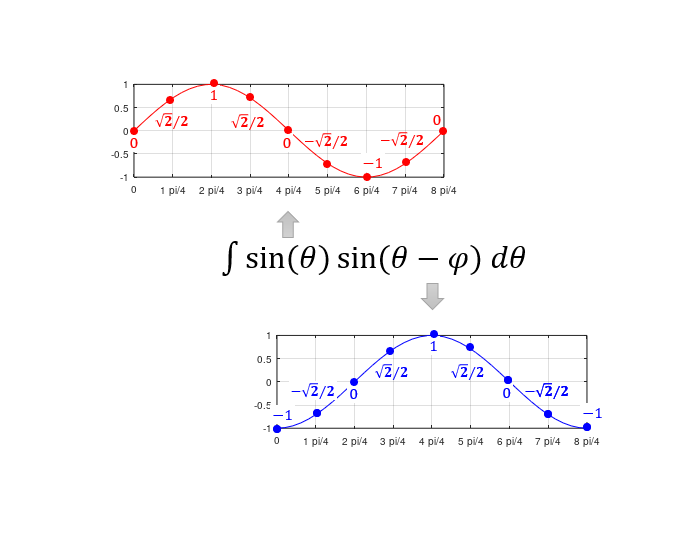
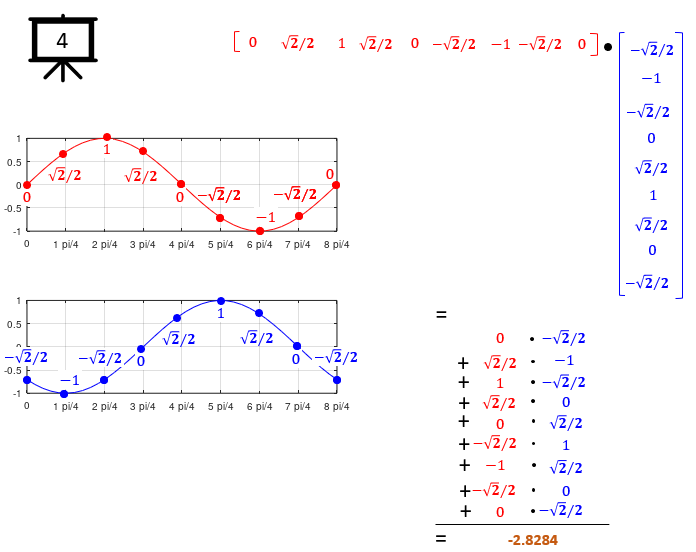
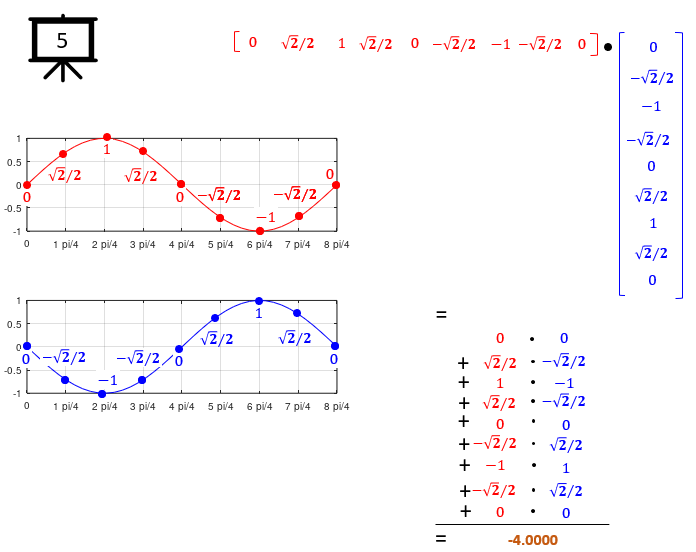
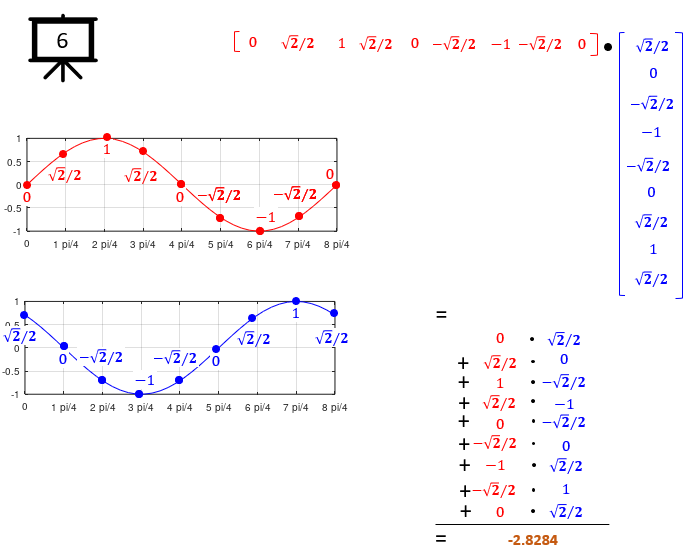
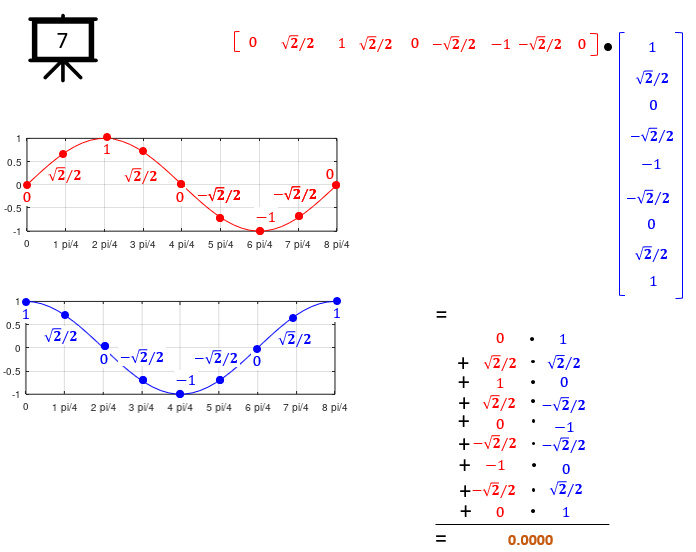
plot(t,sin(t),'r-');
plot(nt,sin(nt),'ro','MarkerFaceColor',[1 0 0],'MarkerSize',7);
xlim([0 2*pi]);
ylim([-1 1]);
set(gca,'xtick',[0 0.25*pi 0.5*pi 0.75*pi pi 1.25*pi 1.5*pi 1.75*pi 2.0*pi]);
set(gca,'xticklabel',{'0','1 pi/4','2 pi/4','3 pi/4','4 pi/4','5 pi/4','6 pi/4','7 pi/4','8 pi/4'});
grid on;
hold off;
n = 2.0;
subplot(2,3,[4 5 6]);
hold on;
plot(t,sin(n * t),'b-')
plot(nt,sin(n * nt),'bo','MarkerFaceColor',[0 0 1],'MarkerSize',7);
xlim([0 2*pi]);
ylim([-1 1]);
set(gca,'xtick',[0 0.25*pi 0.5*pi 0.75*pi pi 1.25*pi 1.5*pi 1.75*pi 2.0*pi]);
set(gca,'xticklabel',{'0','1 pi/4','2 pi/4','3 pi/4','4 pi/4','5 pi/4','6 pi/4','7 pi/4','8 pi/4'});
grid on;
hold off;
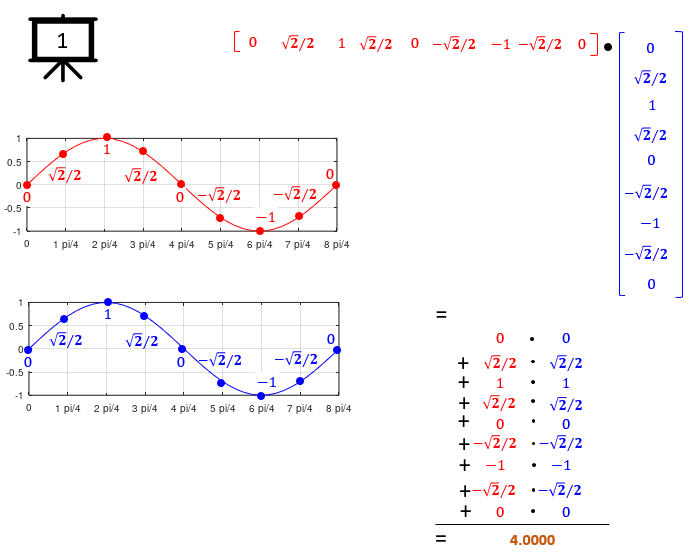
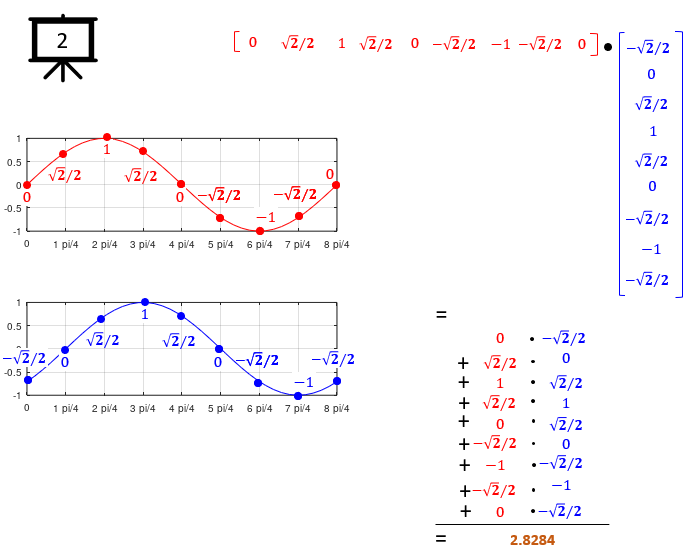
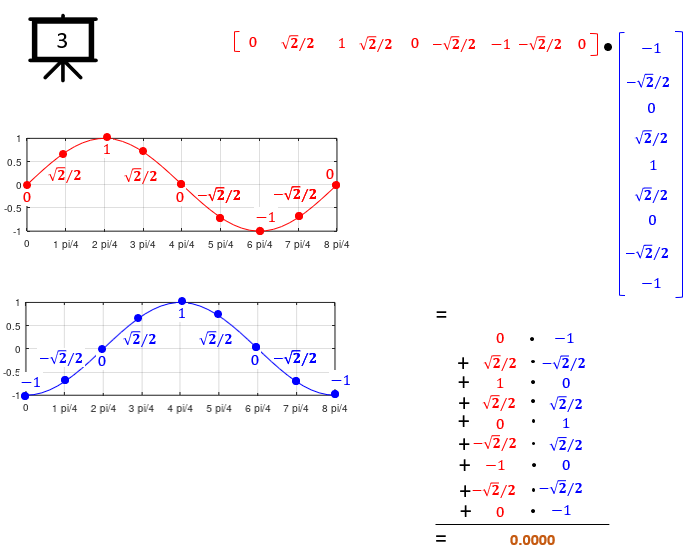
v1 = sin(nt);
v2 = sin(n * nt)
v1 * v2'
|