|
Followings are the code that I wrote in Octave to creates all the plots shown in this page. You may copy these code and play with these codes. Change variables and try yourself until you get your own intuitive understanding.
< Code 1 >
clear all;
% vertices of the cube
vert = [-0.5 -0.5 -0.5; ...
-0.5 0.5 -0.5; ...
0.5 0.5 -0.5; ...
0.5 -0.5 -0.5; ...
-0.5 -0.5 0.5; ...
-0.5 0.5 0.5; ...
0.5 0.5 0.5; ...
0.5 -0.5 0.5];
fac = [1 2 3 4; ...
2 6 7 3; ...
4 3 7 8; ...
1 5 8 4; ...
1 2 6 5; ...
5 6 7 8];
hFig = figure(1,'Position',[300 300 600 500]);
% transformed object
% This code add a vector to each vertices of the cube and store the result into TxVertices
phi = pi/6;
Sx = 1.0;
Sy = 1.0;
Sz = 1.0;
Sh12 = 0.0;
Sh13 = 0.0;
Sh21 = 0.0;
Sh23 = 0.0;
Sh31 = 0.0;
Sh32 = 0.0;
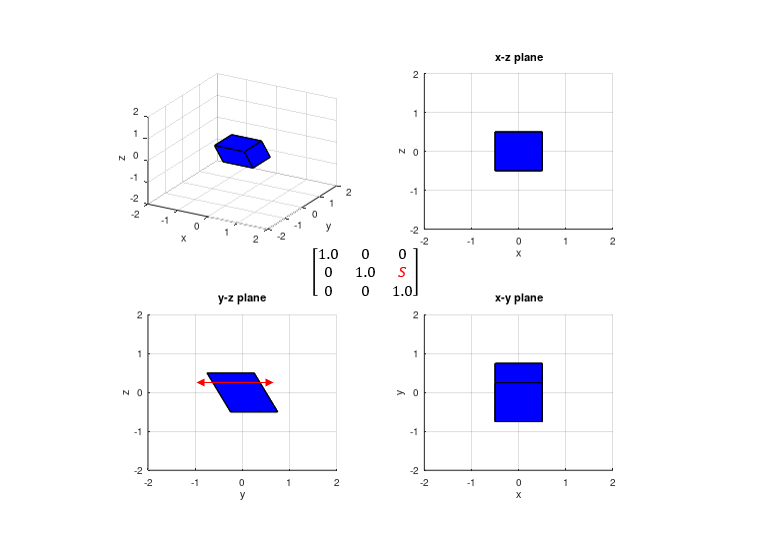
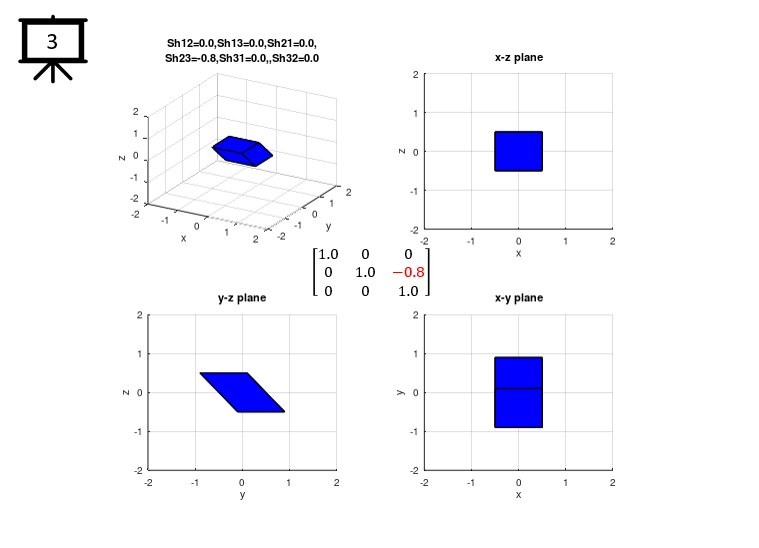
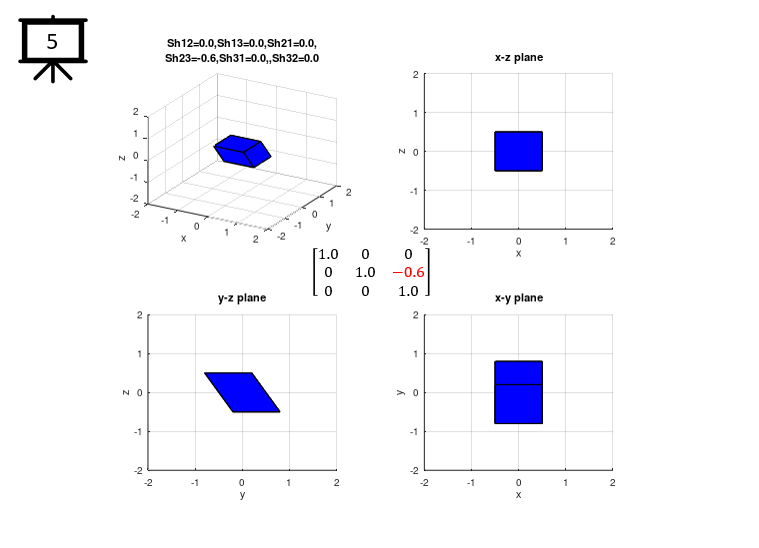
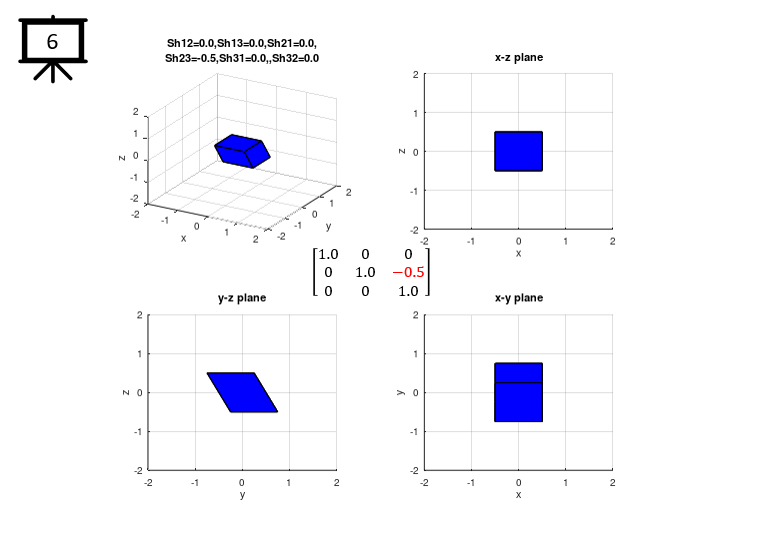
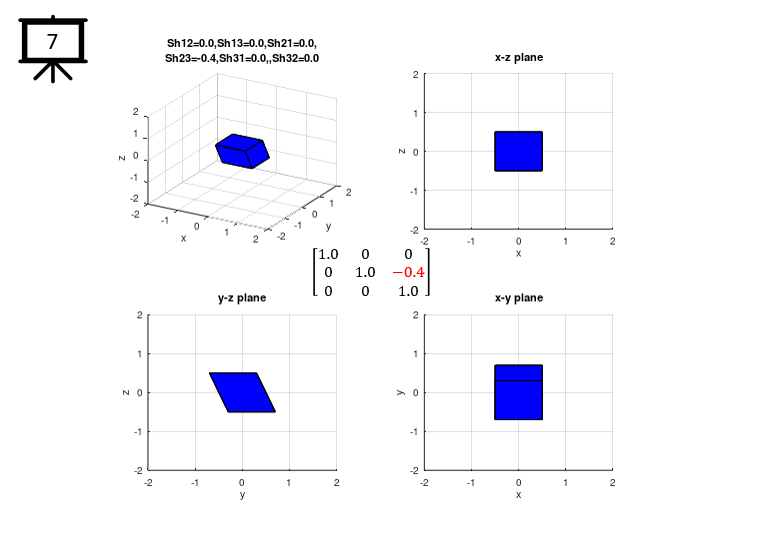
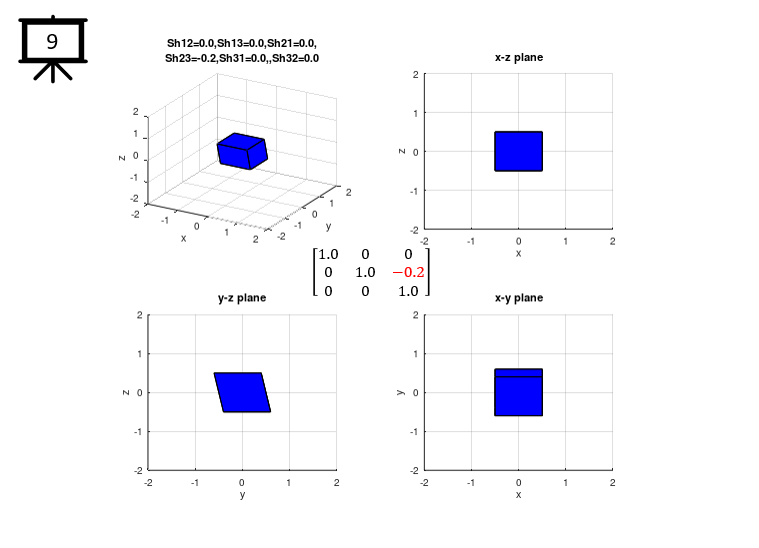
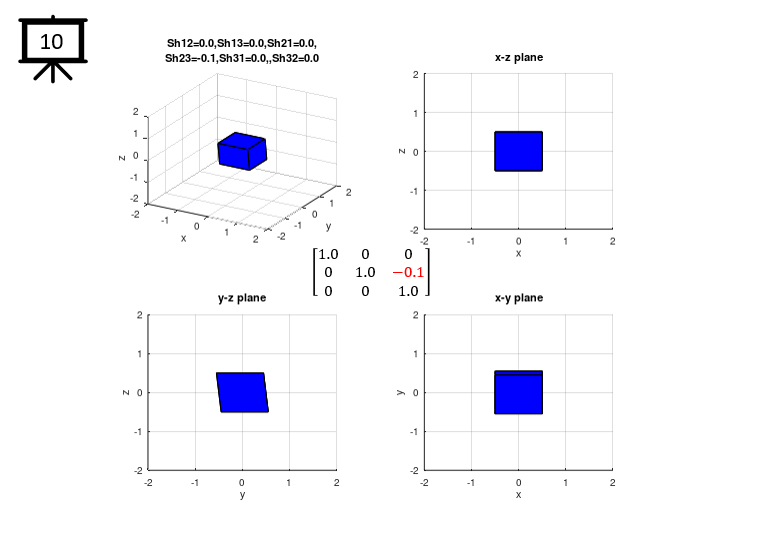
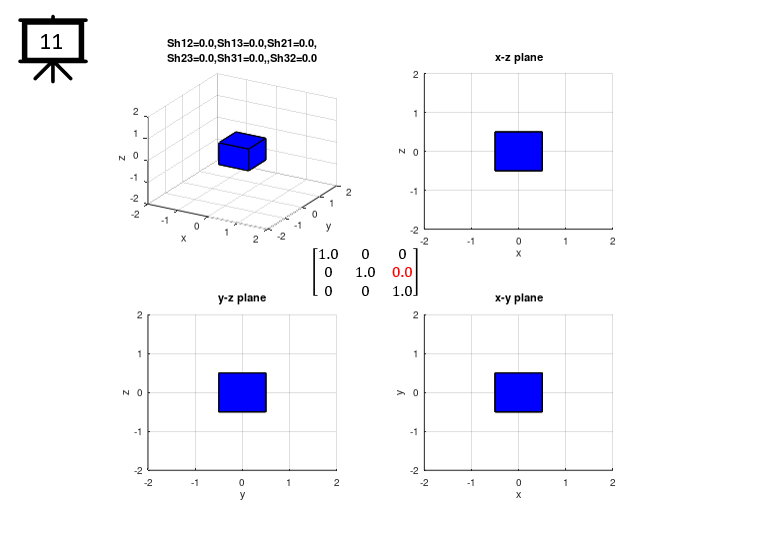
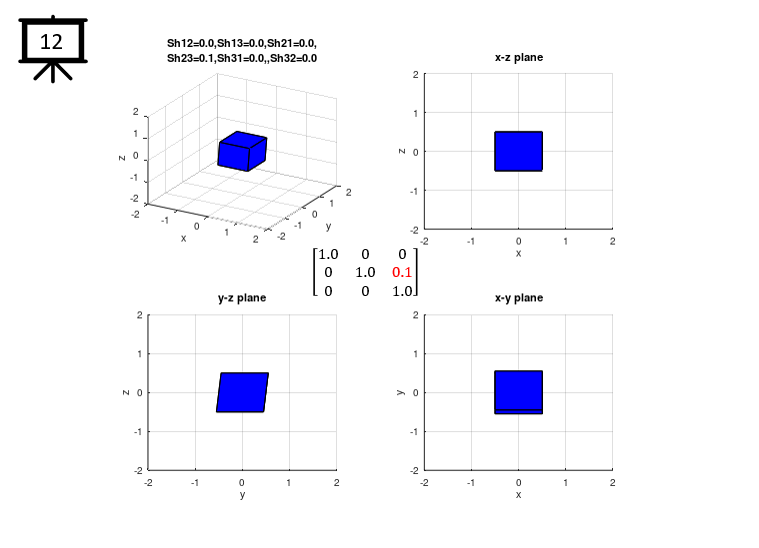
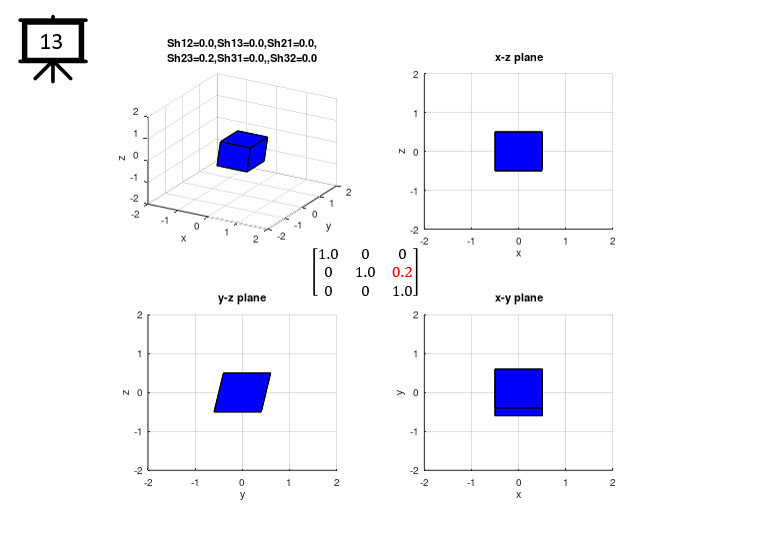
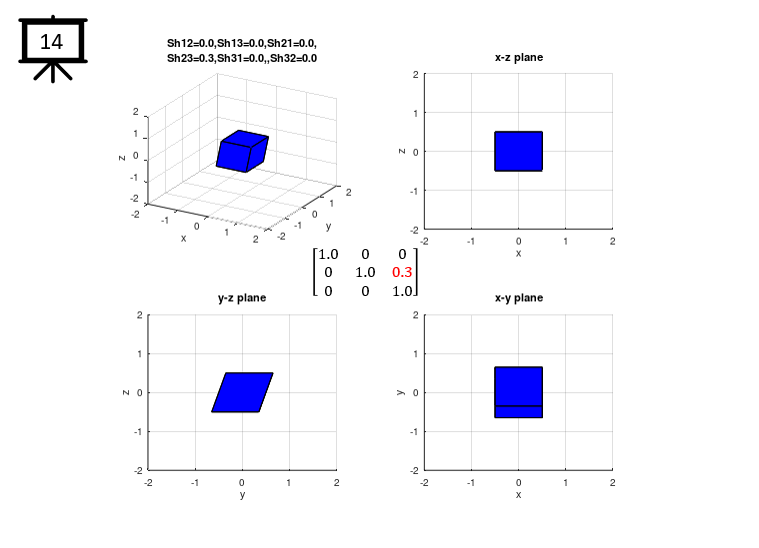
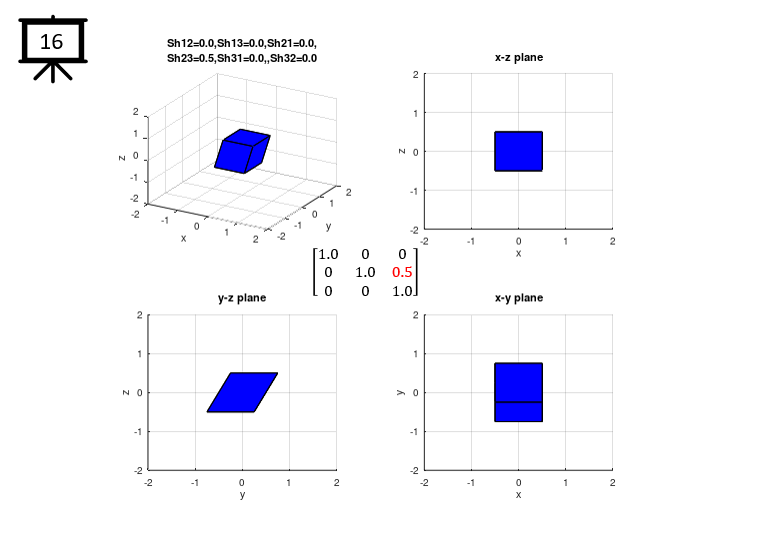
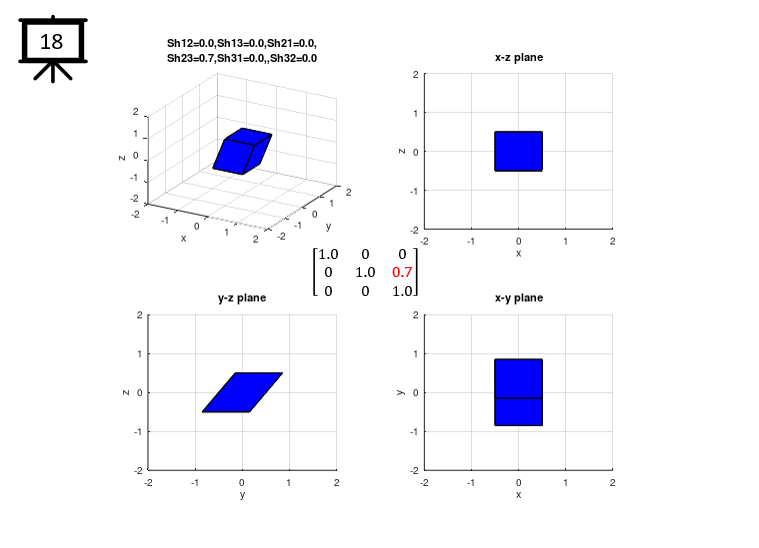
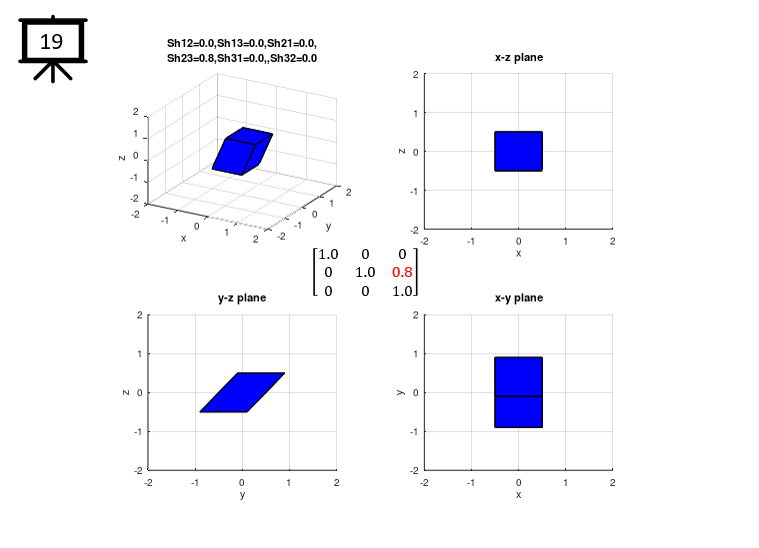
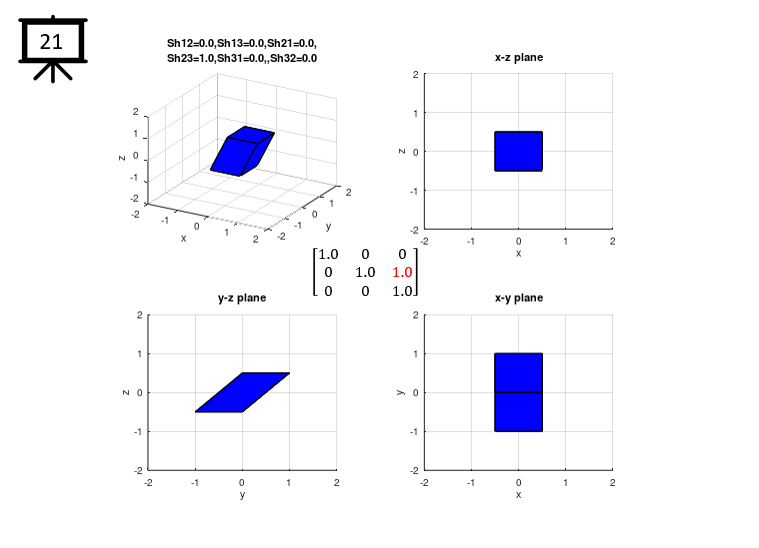
TxMatrix = [Sx Sh12 Sh13 ; ...
Sh21 Sy Sh23; ...
Sh31 Sh32 Sz];
TxVertices = TxMatrix * vert';
TxVertices = TxVertices';
% transformed object
subplot(2,2,1);
patch('Faces',fac,'Vertices',TxVertices,'FaceColor','b');
axis([-2 2 -2 2 -2 2]);
grid();
view(30,30);
title('transformed');
xlabel('x');ylabel('y');zlabel('z');
tStr = sprintf("Sx = %0.1f, Sy = %0.1f, Sz = %0.1f",Sx,Sy,Sz);
title(tStr);
% view along y-axis (x-z plane)
subplot(2,2,2);
patch('Faces',fac,'Vertices',TxVertices,'FaceColor','b');
axis([-2 2 -2 2 -2 2]);
grid();
view(0,0);
title('x-z plane');
xlabel('x');ylabel('y');zlabel('z');
% view along x-axis (y-z plane)
subplot(2,2,3);
patch('Faces',fac,'Vertices',TxVertices,'FaceColor','b');
axis([-2 2 -2 2 -2 2]);
grid();
view(90,0);
title('y-z plane');
xlabel('x');ylabel('y');zlabel('z');
% view along z-axis (x-y plane)
subplot(2,2,4);
patch('Faces',fac,'Vertices',TxVertices,'FaceColor','b');
axis([-2 2 -2 2 -2 2]);
grid();
view(0,90);
title('x-z plane');
xlabel('x');ylabel('y');zlabel('z');
|